The Operome Dividend
September 14, 2026

What happens to growth, employment, public finances and the transatlantic gap when a fifth of an economy's companies, and its public administration, operomise their operations. An EU-27 estimate.
What happens to growth, employment, public finances and the transatlantic gap when a fifth of an economy's companies, and its public administration, operomise their operations. An EU-27 estimate.
Abstract. This paper estimates the economic effect of operomisation, the compilation of governing rules into machine-executable, citable and reproducible form, at realistic adoption: a fifth of EU companies by count, weighted to where rules bind hardest, and two thirds of public administrative functions. On the EU-27's 2025 output of €18.8 trillion, the central case yields a recurring €280 billion a year of GDP (1.5 per cent), a separate €110 billion annual fiscal dividend, and +0.15 percentage points of annual growth over a ten-year phase-in, with a range of €80 to €685 billion. The mechanism requires no treaty, no directive and no change to the content of any rule, and closes a fifth to nearly half of the transatlantic growth differential depending on scenario. Assumptions are stated in full in Section 11.
Disclosure of interest. SynapseLayer builds the infrastructure this paper models. The method is bottom-up from Eurostat and Commission data, every parameter is sourced or labelled as an assumption, and the paper's unconditional estimates are deliberately placed below the published academic range so that the reader can check the model rather than trust the author.
- €280bn / yr — Central-case recurring GDP effect at full phase-in, 1.5% of EU-27 output
- +0.15 pp — Added to annual growth over a ten-year phase-in, against a 1.2% trend
- €110bn / yr — Fiscal dividend to treasuries: VAT gap, procurement, benefits integrity
01 · Executive summary
To operomise an organisation is to compile its governing rules, the statutes, regulations, contracts, policies and processes that bind its operations, into machine-executable, citable and reproducible rule sets that return deterministic verdicts with clause citations. The rules do not change. The cost of demonstrating that they are followed collapses, because verification moves from manual review to compiled evaluation. Companies are the obvious adopters. The larger one is the state, since executing rules is what a public administration does all day: it assesses tax, grants permits, administers benefits, awards contracts and adjudicates claims. This paper models both.
The adoption scenario is deliberately modest on the corporate side and substantial on the public side: a fifth of EU companies by count, weighted to where rules bind hardest, which covers about 45 per cent of business-economy1 value added, plus two thirds of public administrative functions compiled onto deterministic rulebooks. On the EU-272's 2025 output of €18.8 trillion, the combined static effect is a recurring gain of roughly €280 billion a year, a 1.5 per cent level effect on GDP, phased in over a decade at about +0.15 percentage points of annual growth. The plausible range runs from €80 billion to €685 billion. A dynamic channel adds a further 0.1 to 0.6 per cent of GDP by year ten as compiled rulebooks make agent-driven automation certifiable in regulated processes, private and public alike.
EXHIBIT 1 · Headline results by scenario (2025 prices)
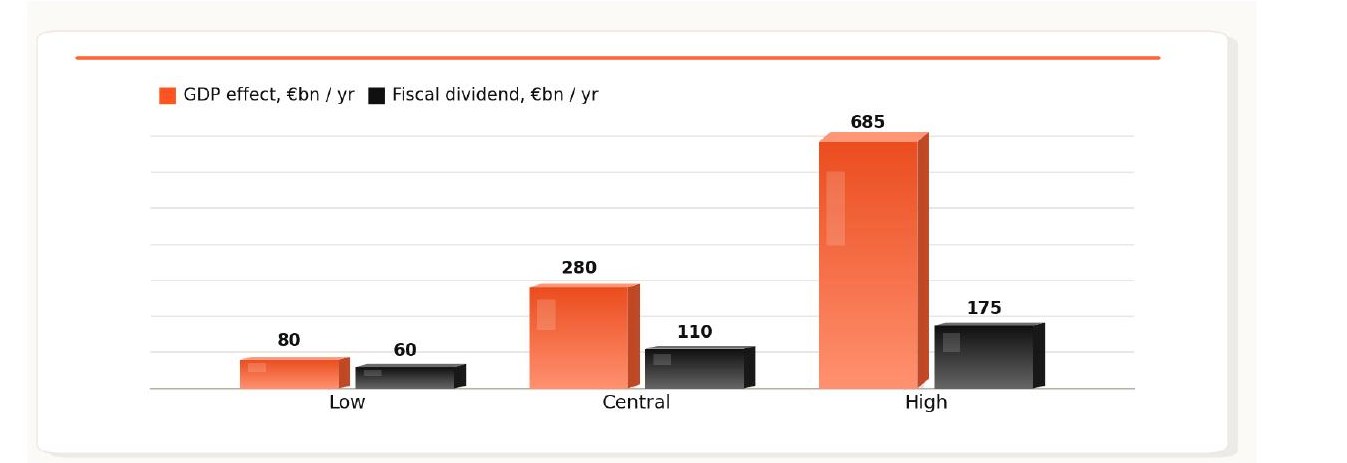
Static channels at full phase-in; ten-year linear phase-in. Dynamic channel adds 0.1 to 0.6% of GDP by year ten. GDP effects and fiscal dividend are never added to each other.
- ≈ Portugal — The central case adds roughly one Portugal of output to the EU, every year, in perpetuity
- 7x — The Commission's entire €37.5bn simplification target, with every protective standard intact
- ~1.5x — The EU's annual budget, recovered from friction rather than raised from taxpayers
Alongside the GDP effect sits a fiscal dividend that a corporate-only model never sees: roughly €110 billion a year3 at the centre, from partial recovery of the €128 billion VAT compliance gap, efficiency in a public procurement4 market of around 14 per cent of GDP, and lower error and fraud in benefits administration. These are transfers and collections rather than output, so they are reported separately, and they accrue to treasuries directly. The estimate speaks to Europe's two defining constraints. On the transatlantic gap, US real growth outpaced5 Europe's by roughly 0.8 percentage points a year over the past decade; the central case closes about a fifth of that differential and the high case approaches half, and the mechanism is asymmetric in Europe's favour, because Europe carries more rules per euro of output and therefore gains more per unit of rule-cost compression than the6 US can. On demographics, the workforce is projected to shrink by close to 2 million workers a year by 2040; the central case supplies the output of roughly 3 million workers, which lets Europe fund its social model from productivity rather than from population growth.
02 · The premise: compiled rules, not observed behaviour
Every regulated or rule-intensive organisation runs two production systems. The first produces its goods, services or administrative decisions. The second produces evidence that the first complies with the rules that govern it. The second system is large, labour-intensive and almost entirely manual: lawyers interpreting clauses, compliance teams checking transactions, controllers reconciling reports, caseworkers verifying eligibility, procurement officers documenting award criteria. Probabilistic AI cannot replace it, because a system that is right most of the time cannot certify anything, and both regulated industries and public administrations require certification, reproducibility and an audit trail. The constraint is not confined to regulated sectors. Any rule-governed business carries the same second system, and Europe carries more of it than anyone: the Mittelstand's decades, in places centuries, of codified process, craft standards and quality discipline are an accumulated rulebook no other economy possesses at this depth. That inheritance has been treated as overhead. Compiled, it
becomes infrastructure, and the discipline nobody does better than Europe becomes the discipline nobody can copy digitally.
An operome resolves this by compiling the governing documents themselves into executable logic. Each rule becomes a deterministic evaluation that renders one of three verdicts, PASS, FAIL or UNKNOWN, with a citation to the clause that produced it and a reproducible run record. UNKNOWN is a first-class outcome that escalates to a human, which is what makes the approach deployable where a wrong answer is worse than no answer, in a bank and in a benefits office alike. The distinction from process-mining and model-induced approaches is structural: those systems infer rules from observed behaviour, an operome compiles them from the authoritative text. Rules run by rule, not by observation. For the public sector the fit is exact, because statutes and regulations are the administration's production instructions, and compiling them is a translation of what the institution already is.
03 · The adoption scenario: a fifth of companies, plus the state
The corporate side of the scenario exploits a fact of firm-size distributions. The EU business economy contained about 33 million enterprises in 2023; SMEs are 99.8 per cent of them and contribute 51.4 per cent of value added,7 while large enterprises, 0.2 per cent by count, contribute 48.6 per cent. Adoption follows rule intensity, because the return on operomisation is proportional to the volume and complexity of rules a firm must demonstrate compliance with, so banks, insurers, issuers, pharmaceutical and medical companies, energy and telecoms operators, defence suppliers and firms inside the CSRD, GDPR, AI Act and sectoral supervisory perimeters adopt first. A fifth of companies by count, weighted that way, covers roughly 45 per cent of business-economy value8 added, a covered base of about €5.1 trillion.
EXHIBIT 2 · A fifth of firms covers half the economy
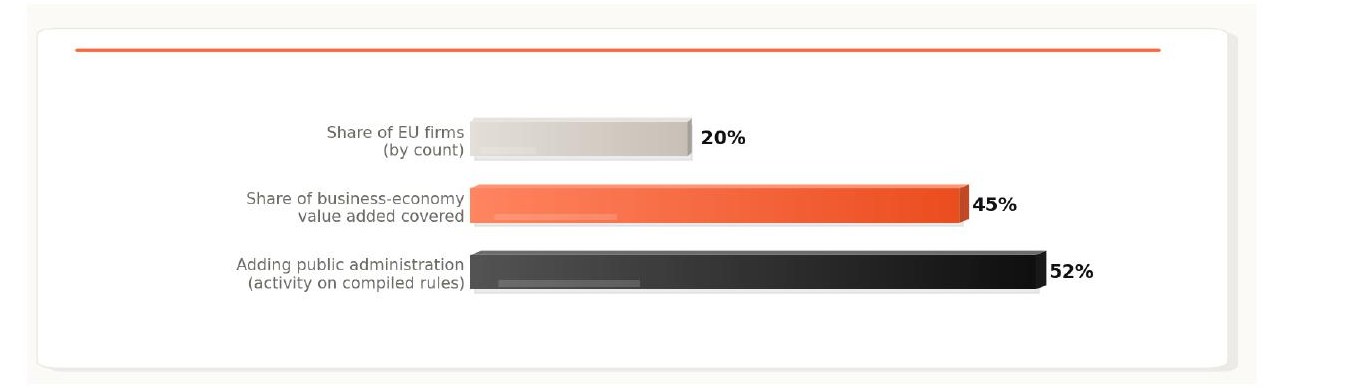
Firm-size shares: Eurostat structural business statistics, 2023. Business-economy base assumed at 60% of GDP; public administration VA at ~7% of GDP.
The public side is the larger structural claim. General government in the EU raises and spends close to half of GDP, and the functions through which it does so, tax assessment, customs, permits and licensing, benefits and subsidy administration, procurement, registries, supervision and courts, are rule execution in pure form. Public9 administration as a production sector generates around 7 per cent of GDP in value added, roughly €1.3 trillion, before counting the private activity that waits on its decisions. The central case assumes two thirds of administrative functions run on compiled rulebooks by year ten. Public adoption does not proceed firm by firm; it proceeds statute by statute, and a single member state compiling its tax code or permitting regime operomises that function for every firm and citizen at once, which is why a modest legislative-programme's worth of compilation covers a disproportionate share of the economy's rule executions.
04 · What the rulebook costs today, on both sides of the counter
The private baseline is partly priced by the Commission itself. Its target of reducing administrative burden by at10 least 25 per cent equates to €37.5 billion in annual savings by 2029, implying that the recurring reporting layer alone costs EU businesses around €150 billion a year, and that layer excludes interpretation, legal review, transaction-level verification, internal controls, audit preparation and remediation. The Draghi report assembled the firm-level evidence: CSRD compliance at €150,000 to €1 million per company, GDPR compliance at roughly €1.3 million for a mid-sized firm, more than 13,000 EU regulatory acts adopted since 2019, and 61 per cent of companies naming regulation as a major long-term barrier to investment.11 Reporting, however, is only the visible layer. For every euro a firm spends producing reports, it spends several more interpreting the rules, checking transactions against them, running internal controls, preparing audits and fixing errors. The model assumes this12 full compliance cost is three to five times the reporting cost for the firms covered.
- ~€150bn — Implied annual cost of the reporting layer alone, from the Commission's own 25% target
- €128bn — EU VAT compliance gap, 2023: tax owed under the rules but never collected
- ~14% of GDP — Annual public procurement, administered through document-based checking
The public baseline is measured in leakage and delay. The VAT compliance gap exists because verification of13 millions of transactions against the rules is manual, sampled and slow. Procurement runs at roughly €2 trillion a14 year through document-based compliance checking at every stage. Permitting is the channel through which administrative delay taxes private output: the Draghi report treats slow authorisation, in energy and infrastructure15 above all, as a first-order competitiveness problem. None of these costs appears in a corporate-only model, which is why the first version of any operomisation estimate understates the total.
Two further effects belong here even though the model does not price them. Deterministic verification removes discretion at exactly the points where corruption lives, in permits, procurement awards and benefit decisions, and the sums at stake are large: the Commission put the cost of corruption to the EU economy at €120 billion a year in 2014, and econometric work for the European Parliament later estimated the true annual loss at between €179 and €990 billion.16 A rulebook that evaluates identically for every applicant is the cheapest anti-corruption instrument yet proposed. And the people released from producing compliance evidence do not vanish into a cost line; they become available for the work machines cannot do, client relationships, product development and invention, which is where the redeployment channel of Section 5 understates its own long-run value.
05 · Six static channels, one dynamic channel
The four corporate channels operate on covered firms' value added. Verification cost compression is worth 0.6 to 2.0 per cent of covered value added; redeployment of rule-governed labour, the 8 to 12 per cent of working hours that rule-intensive firms spend producing compliance evidence, is worth 0.8 to 2.5 per cent; cycle-time compression adds 0.2 to 1.0 per cent through faster capital rotation; and lower error, rework and enforcement
costs add 0.2 to 0.7 per cent.17 The two public channels differ in kind. Administrative productivity lets the same administration process assessments, permits, filings and claims at 5 to 10 per cent lower resource cost on covered functions. The delay channel carries a multiplier: when authorisations return in days rather than quarters, private investment that queues behind the administration is executed earlier and some becomes viable at all,18 worth 0.1 to 0.4 per cent of GDP.
EXHIBIT 3 · Building the central case, €bn / yr at full phase-in
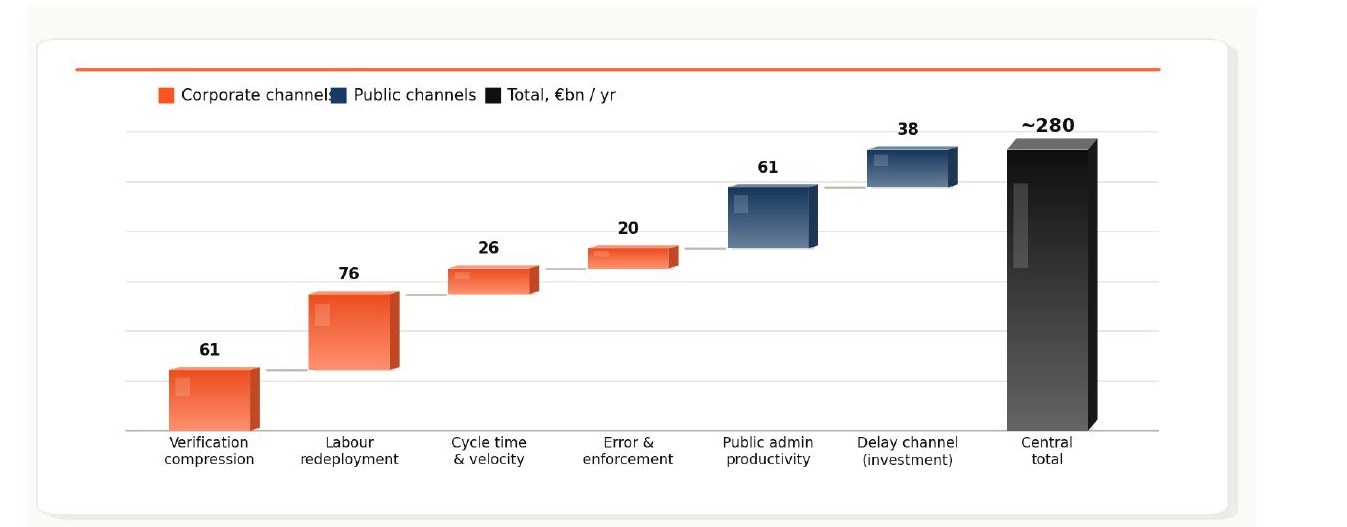
Corporate channels applied to a €5.1tn covered base; public channels to covered administration VA and to GDP respectively. Ranges: Section 11.
The dynamic channel compounds where the static channels plateau. Agent-driven automation of regulated processes has stalled on a certification problem: neither an enterprise nor a ministry can delegate a regulated decision to an agent whose reasoning it cannot reproduce or cite. A compiled rulebook removes that constraint on both sides of the counter at once, because the agent's actions are checked against a deterministic substrate at decision time, and the same substrate serves the firm submitting and the authority deciding. The model treats this as a total-factor-productivity contribution of 0.05 to 0.15 percentage points a year on the covered share of the economy from year five, worth a further 0.1 to 0.6 per cent of GDP by year ten. Nothing in this channel is confined to regulated sectors. Any business that runs on rules, its own contracts, service levels, credit policies and operating procedures, can compile them, and in an agent-to-agent economy that compilation is what makes a firm transactable: agents deal with counterparties whose commitments they can verify at machine speed, and a compiled rulebook turns a company into a citadel whose boundaries the rules themselves enforce.
06 · The fiscal dividend
Three public-sector effects improve government finances without appearing in GDP, and a disciplined estimate keeps them apart. Compiled transaction-level verification of VAT recovers part of the compliance gap; the model takes 25 to 55 per cent of the €128 billion,19 on the logic that the gap's compliance component, evasion, error and insolvency-adjacent leakage, shrinks when every invoice chain is evaluated against the rules continuously rather than sampled retrospectively. Procurement efficiency across a €2 trillion market contributes 1 to 3 per cent of relevant spend, counted only to the extent it is a true resource saving. Benefits and subsidy administration contributes through lower error and fraud rates.
EXHIBIT 4 · Fiscal dividend, central case composition

Transfers and collections, €bn / yr at full phase-in, reported separately from GDP effects. Range across scenarios: ~€60bn to ~€175bn. VAT gap base: European Commission, 2023.
The natural use of €110 billion a year is the investment agenda Europe has already written for itself. The Draghi20 report puts the additional investment the EU needs at up to €800 billion a year; a recurring fiscal dividend of this size funds roughly a seventh of it, recovered from friction rather than raised from taxpayers or borrowed against a debt stock that already constrains half the member states. The debt arithmetic works from both sides. EU21 general government debt stands at roughly 80 per cent of GDP; a 1.5 per cent level effect on output lowers that ratio by around one percentage point through the denominator alone, and nearly three in the high case, before a euro of the dividend touches the numerator. Growth is the only debt strategy that requires no austerity, and this is a growth instrument.
07 · Employment and demographics: funding the social model from productivity
The employment effect within adopting organisations is a recomposition of work. In covered firms and administrations, between two and four per cent of labour input currently produces compliance evidence rather than output or decisions. Operomisation redeploys most of that time rather than removing the people, because the binding constraint in rule-intensive functions is unmet demand for judgement, casework quality, client service and new product development, and every UNKNOWN verdict routes to a human, which concentrates skilled work exactly where human judgement carries value. Compressed compliance cost also lowers the fixed-cost barrier that keeps smaller firms out of regulated markets, cross-border trade and public procurement, and entry at that margin creates jobs.
The macroeconomic employment question is the reverse of the one usually asked. Europe's problem for the coming two decades is too few workers: the workforce is projected to shrink by close to 2 million workers a year by 2040,22 while the population drawing pensions, health care and long-term care grows. An economy can respond on the labour side, through higher participation, longer working lives and immigration, or on the productivity side, through more output per worker. The central case supplies a recurring €280 billion of output,23 the equivalent of roughly 3 million workers at average EU output per person employed.
EXHIBIT 5 · The productivity option against the demographic constraint
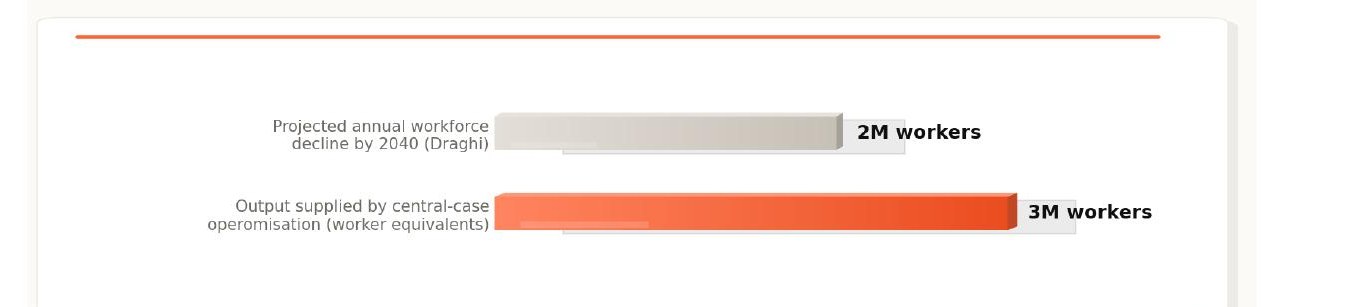
Worker equivalents at average EU output per person employed (~€90k). Workforce decline: Draghi (2024).
That substitution has fiscal and political value beyond the arithmetic. Output produced through productivity funds the transfer system without adding claimants to housing, schools, health systems and integration budgets, so each point of productivity-driven growth eases the fiscal cost of demographic ageing twice, once by raising the revenue base and once by reducing the scale of labour migration otherwise required to hold output constant. Migration remains one instrument among several, and nothing in this model prices people; what the model shows is that operomisation enlarges the productivity option, which is the only response to demographic decline that is entirely within Europe's own control.
08 · The transatlantic gap: what operomisation can and cannot close
The Draghi report has one underlying subject, productivity, and Europe has so far treated that subject as a lament. It can be treated as a target instead. The raw material for the most competitive rule-governed economy in the world already exists, written into Europe's statute books, contracts and process manuals over decades; compilation is what turns that inheritance from drag into propulsion.
The comparison with the United States must nonetheless be stated carefully, because the crude version flatters the argument and would be taken apart. In nominal dollar terms the EU economy fell from 110 per cent of US GDP24 in 2008 to 67 per cent in 2023, but a large share of that headline is exchange-rate movement; in purchasing -25 power terms the two economies remain close in aggregate size. The real deficit is growth and productivity: US26 real growth averaged roughly 2.5 per cent a year over 2015 to 2024 against about 1.7 per cent for Europe, and the Draghi report identifies the productivity slowdown as the principal driver, with real disposable income per27 head having grown almost twice as fast in the US as in the EU since 2000.
EXHIBIT 6 · Real GDP paths to 2040, indexed
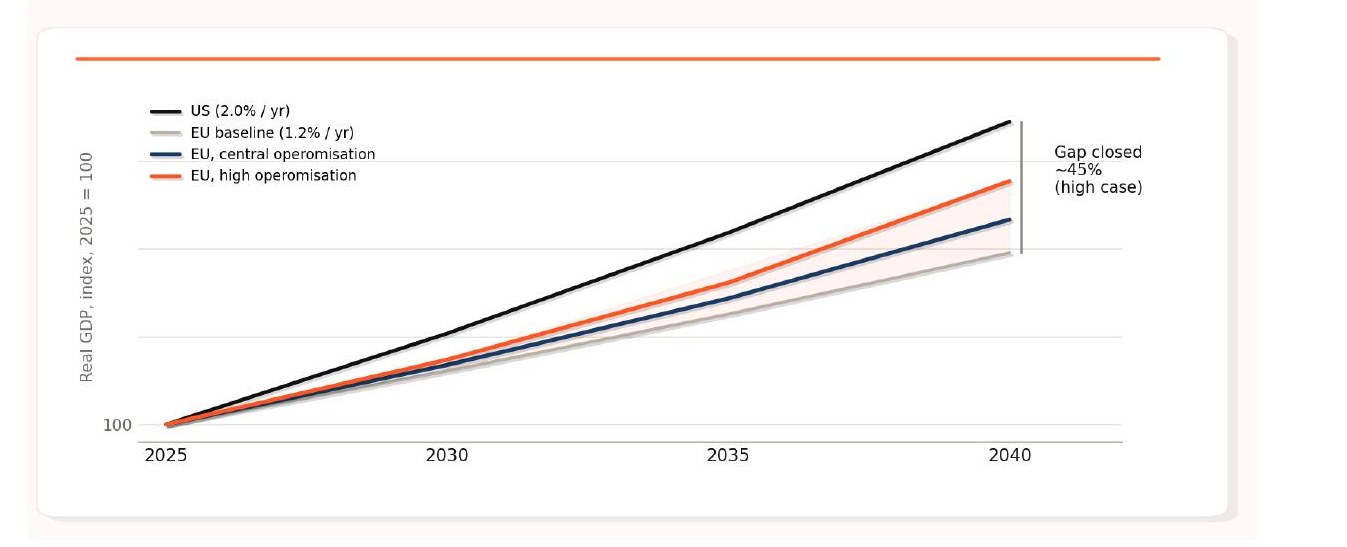
Stylised paths: US at 2.0% / yr, EU baseline at 1.2% / yr, operomisation cases add static effects over a ten-year phase-in plus the dynamic channel from year five. The high case closes ~45% of the 2040 gap and is still converging.
Against a differential of roughly 0.8 percentage points a year, the central case's +0.15 points closes about a fifth, rising towards a quarter once the dynamic channel matures, and the high case approaches half. Operomisation alone therefore does not close the transatlantic gap, and this paper does not claim it does. Three things can be claimed. It is among the largest single growth levers available to Europe that requires no treaty change, no new directive and no political capital, which distinguishes it from nearly everything else on the competitiveness agenda. Its fiscal dividend part-funds the investment programme that the rest of the catch-up requires. And it is the one lever that is asymmetric in Europe's favour: the gain from rule-cost compression is proportional to the stock of rules, Europe carries more rules per euro of output than the US, and identical adoption on both sides of
the Atlantic therefore narrows the gap rather than preserving it. Europe's regulatory density, the standing exhibit in every account of its decline, converts under compilation into the one input it holds in greater quantity than its competitor.
09 · The regime scenario: the admission ticket
Everything to this point prices operomisation as a cost technology: verification gets cheaper, labour is redeployed, queues shorten. The dynamic channel hinted at a different kind of claim, and it deserves to be stated in full, clearly labelled as a scenario rather than an estimate. Agent-driven automation is the productivity event the macro forecasters are pricing: Goldman Sachs puts generative AI at 7 per cent of global GDP and +1.5 percentage points of annual productivity growth in developed markets over a decade,28 the McKinsey Global Institute puts generative AI at $2.6 to 4.4 trillion a year and AI plus automation at up to 1.5 to 3.4 percentage points of annual GDP growth,29 and McKinsey sizes agentic commerce alone at $3 to 5 trillion globally by 2030.30 The sceptical
anchor is Acemoglu, who arrives at roughly 1 per cent of GDP over a decade.31 The dispersion is enormous, and this paper takes no view on where within it the truth lies.
What the paper does take a view on is a gating condition the macro estimates skip. Roughly half of European value added sits in rule-intensive activity,32 finance, insurance, health, pharmaceuticals, energy, telecoms, defence and the public administration itself, where no enterprise and no ministry can delegate a regulated decision to an agent whose reasoning it cannot reproduce, cite and audit. In those activities, whatever agentic productivity materialises is captured only where a deterministic substrate exists to certify it. Without compiled rulebooks, Europe participates in the agentic economy on its unregulated half and forfeits it on the half where its comparative institutional depth actually lies. The regime scenario prices that condition: if agentic AI delivers within the Goldman range in deployable activities, certifiability across the rule-intensive half of the economy is worth of the order of 0.5 to 1.0 percentage points of annual growth beyond the central case, a level difference of 6 to 12 per cent of GDP by 2040, €1.1 to 2.2 trillion a year in 2025 prices. That is conditional on the agentic productivity event occurring at forecast scale and on the certifiability thesis holding, and the exhibit below places it honestly among the published estimates: this paper's unconditional cases sit below the most sceptical academic figure, and its one reach layer sits below the mainstream forecasts it conditions on.
EXHIBIT 7 · The estimate ladder: where this paper sits
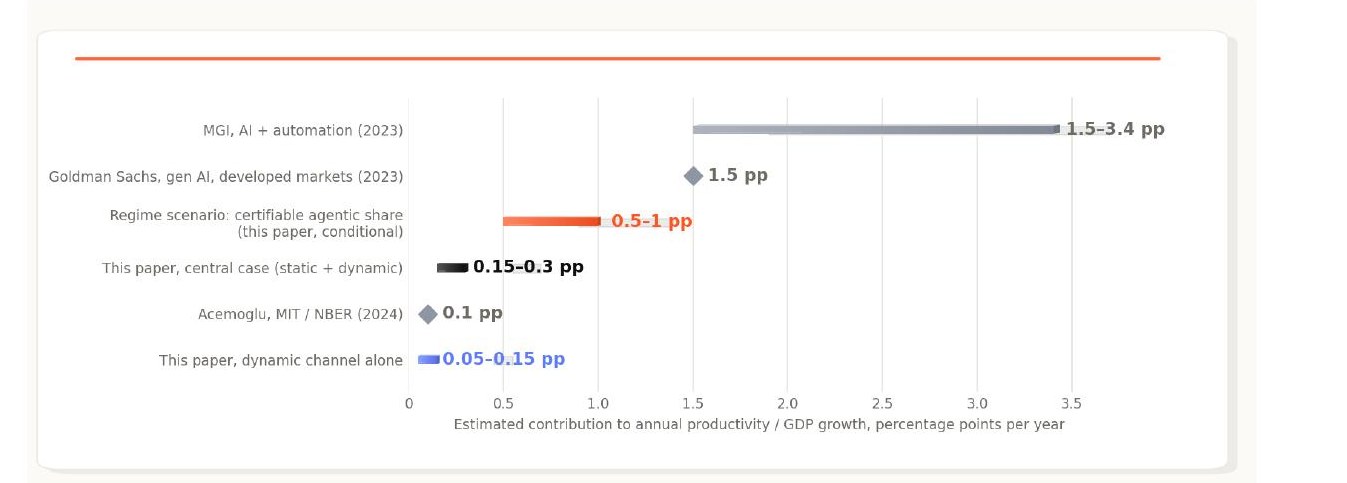
Published AI macro estimates against this paper's cases. External estimates: Goldman Sachs (2023), McKinsey Global Institute (2023), Acemoglu / NBER (2024). Regime scenario is conditional on the certifiability thesis and on agentic productivity materialising at forecast scale.
One historical comparison disciplines both directions. The last infrastructure wave to promise deterministic trust generated forecasts of this class with no production evidence behind them: the World Economic Forum projected
in 2015 that 10 per cent of global GDP would be stored on blockchain by 2027,33 and PwC valued blockchain at34 $1.76 trillion of global GDP by 2030. Neither came close, because blockchain certified records while leaving the execution of governing rules exactly where it found it, in manual interpretation. Operomisation makes the inverse offer: a floor and central case built bottom-up from measured cost pools and a production system, and a single conditional reach layer that claims less than the mainstream AI forecasts while resting on the one thing the blockchain era never produced, governing rules running in production. The trillion-scale numbers of that era were attached to the wrong layer of the stack; the layer they belonged to is the one modelled here.
10 · Unit regulatory cost as a location factor
Economies compete on unit labour cost; rule-intensive economies also compete on unit regulatory cost, the cost of demonstrating compliance per euro of output. The policy response to date, simplification, lowers that cost by35 reducing what the rules ask, and buys its €37.5 billion target through contested legislative procedure. Operomisation attacks the same cost from the technology side, at several times the magnitude, with the protective content of every rule intact, and the two are complements rather than rivals. A jurisdiction whose firms and administration carry compiled rulebooks can sustain high standards at low compliance cost, which converts regulatory density from a liability into a defensible asset. The first-mover effect compounds it: operomes are composable and federate across domains and jurisdictions, so the first economy to compile its corporate perimeters and its administrative law does not merely lower its own costs, it produces the compiled rule infrastructure that trading partners, supervisors and export markets then adopt, in the way early standard-setters in accounting and payments exported their frameworks along with their services.
Early evidence of the diffusion mechanism is already visible, and it is a market mechanism rather than a policy one. German company formation can now be initiated inside AI assistants: the Munich platform Beglaubigt.de exposes incorporation as an API and conversational app, collecting the details of a GmbH or UG in-dialogue36 before coordinating the notary appointment and commercial-register filing behind the scenes. The significant fact is what this routes around. Demand now expresses itself at the agent surface, and the agent completes with whatever service or jurisdiction can finish the transaction in-conversation, so functions and jurisdictions absent from that surface drop out of the consideration set rather than losing on the merits. Germany's version is a private wrapper over a manual register, which di gitises the queue while the execution of the rules stays human; a jurisdiction that compiles the statute itself and verifies deterministically on the register side completes the same formation because the rules evaluate PASS, at a speed and certainty no wrapper can match. Each function that compiles pulls measurable volume from those that have not, and losing volume forces compilation, function by function and jurisdiction by jurisdiction. Adoption in this model is therefore not a policy hope; it is an adoption externality, and the paper's treatment of adoption as exogenous is conservative for exactly that reason.
Production evidence
The mechanics modelled here are running in production. fDesk, a Luxembourg-regulated financial institution, operates its debt issuance business on a compiled deterministic rulebook: five years running on deterministic rules; nine months running on SynapseL ayer's engine with full AI. Programme setup that conventionally takes around six months completes in around three weeks, and issuance executes no-touch, in real time. The production record: approximately €700 million issued across more than 30 bonds; 99.98 per cent accuracy across 100,000+ automated checks, with zero hallucinations and zero compliance violations; the platform is agent-accessible through an MCP interface; and the finance operome alone carries around 7,000 variables and37 35,000 business rules. On the public side, SynapseLayer has published compiled operomes of the German Criminal Code and of the EU AI Act's core provisions, demonstrating that statutes compile on the same substrate as financial rulebooks. The same production system illustrates the paper's thesis at transaction level: the Giovannini barriers, the fifteen obstacles to integrated European issuance, clearing and settlement identified in
2001 and still substantially in place a quarter-century later,38 are neutralised within fDesk's structure through technology and legal design rather than through the harmonising legislation Europe has waited two decades for.
11 · Method, assumptions and limitations
The model is a transparent bottom-up estimate in constant 2025 prices. Every parameter is either sourced or labelled as an assumption, and the dominant sensitivities are the two coverage assumptions, corporate adoption composition and the share of administrative functions compiled, which together move the result by a factor of three before any channel parameter changes. GDP effects and fiscal effects are never added to each other. Implementation costs, licences, integration and change management, are estimated at 10 to 20 per cent of first-decade gross savings, front-loaded, which delays the net effect by roughly a year without materially reducing the steady-state level.
EXHIBIT 8 · Parameters and bases
| Parameter | Value | Basis |
|---|---|---|
| EU-27 GDP, 2025 | €18.8tn | Eurostat, nama_10_gdp |
| Business-economy VA as share of GDP | ~60% | Assumption |
| Large enterprises' share of business-economy VA | 48.6% | Eurostat SBS, 2023 |
| Corporate coverage (central) | ~45% of business-economy VA | A fifth of firms, rule-intensity-weighted; assumption |
| Public administration VA | ~7% of GDP | Assumption on national-accounts sector shares |
| Public coverage (central) | Two thirds of administrative functions | Assumption |
| Corporate static channels, total | 3.6% of covered VA [1.8–6.2] | Section 5; anchored to Draghi (2024) and Commission burden data |
| Public administrative productivity gain | 5–10% of covered admin VA | Assumption |
| Delay channel | 0.1–0.4% of GDP | Assumption |
| VAT compliance gap, 2023 | €128bn | European Commission |
| VAT gap recovery | 25–55% | Assumption |
| Public procurement market | ~14% of GDP | European Commission |
| US–EU real growth differential, 2015–2024 | ~0.8 pp / yr | US ~2.5% vs Europe ~1.7% |
| Projected workforce decline | ~2M workers / yr by 2040 | Draghi (2024) |
| Rule-intensive share of EU value added | ~50% | Assumption (regime scenario only) |
| Agentic productivity in deployable activities | Goldman-range, conditional | Goldman Sachs (2023); regime scenario only |
| Phase-in; prices | Linear, 10 years; constant 2025 | Assumption |
GDP effects and fiscal effects reported separately throughout.
Limitations are stated rather than buried. The model is partial-equilibrium: it does not capture relative-price effects, demand responses or the reallocation of released resources across sectors. Public-sector productivity is imperfectly measured in national accounts, so the administrative-productivity channel should be read as a resource-cost saving expressed in value-added terms. The VAT-gap recovery range is an assumption about the compliance component of the gap, and the delay channel, though anchored in the competitiveness literature's treatment of permitting, is the least precisely estimable parameter in the model and is bounded accordingly. The transatlantic comparison uses real growth rates rather than nominal levels to avoid the exchange-rate artefact, and the catch-up claims are limited to the share of the growth differential the modelled channels can close: the flow, not the accumulated stock of lost ground. Finally, public coverage of a member state's statute book is a legislative-programme's worth of compilation, and the model treats the decision to undertake it as exogenous, a
European Commission, Giovannini Group, Cross-Border Clearing and Settlement Arrangements in the European Union (2001) and Second Report on EU Clearing and Settlement Arrangements (2003).
conservative treatment given the routing dynamics described in Section 10, under which agent-mediated demand penalises non-compiled functions and jurisdictions directly.
12 · Sources
Full citations with links appear in the footnotes. Principal sources: Eurostat (national accounts; structural business statistics; government finance statistics); European Commission (simplification agenda; VAT gap; public procurement; EU Anti-Corruption Report 2014; Giovannini Group reports 2001 and 2003); M. Draghi, The Future of European Competitiveness (2024); Council of the European Union (simplification of EU rules); World Bank national accounts data; Goldman Sachs Research (2023); McKinsey Global Institute (2023, 2025); D. Acemoglu, NBER Working Paper 32487 (2024); RAND Europe for the European Parliament (2016); World Economic Forum (2015); PwC (2020); IMF World Economic Outlook data; SynapseLayer production data (fDesk).
The paper, as published
The exhibits and charts referenced above appear in full in the PDF edition. Download the full paper (PDF).
Notes and sources
- ↩ Author's assumption; basis and range stated in Section 11 (Exhibit 8).
- ↩ Eurostat, GDP and main components (nama_10_gdp), 2025 figures. https://ec.europa.eu/eurostat/web/products-eurostat-news/w/wdn-20260806-1
- ↩ European Commission, VAT gap in the EU: compliance gap of €128 billion in 2023. https://taxation-customs.ec.europa.eu/taxation/vat/fight-against-vat-fraud/vat-gap_en
- ↩ European Commission, public procurement: around 14% of EU GDP annually. https://single-market-economy.ec.europa.eu/single-market/public-procurement_en
- ↩ GIS Reports (2026): US real GDP growth averaged roughly 2.5% a year over 2015-2024 against about 1.7% for Europe. https://www.gisreportsonline.com/r/us-europe-economic-gap/
- ↩ M. Draghi, The Future of European Competitiveness, September 2024. https://commission.europa.eu/topics/eu-competitiveness/draghi-report_en
- ↩ Eurostat, Structural business statistics overview, 2023. https://ec.europa.eu/eurostat/statistics-explained/index.php?title=Structural_business_statistics_overview
- ↩ Author's assumption; basis and range stated in Section 11 (Exhibit 8).
- ↩ Author's assumption; basis and range stated in Section 11 (Exhibit 8).
- ↩ European Commission, Simplification agenda: at least a 25% reduction in administrative burden, equating to €37.5 billion in annual savings by 2029. https://commission.europa.eu/law/law-making-process/better-regulation/simplification-implementation-and-enforcement/simplification_en
- ↩ M. Draghi, The Future of European Competitiveness, September 2024. https://commission.europa.eu/topics/eu-competitiveness/draghi-report_en
- ↩ Author's assumption; basis and range stated in Section 11 (Exhibit 8).
- ↩ European Commission, VAT gap in the EU: compliance gap of €128 billion in 2023. https://taxation-customs.ec.europa.eu/taxation/vat/fight-against-vat-fraud/vat-gap_en
- ↩ European Commission, public procurement: around 14% of EU GDP annually. https://single-market-economy.ec.europa.eu/single-market/public-procurement_en
- ↩ M. Draghi, The Future of European Competitiveness, September 2024. https://commission.europa.eu/topics/eu-competitiveness/draghi-report_en
- ↩ European Commission, EU Anti-Corruption Report (2014): at least €120 billion a year; RAND Europe for the European Parliament, The Cost of Non-Europe in the Area of Organised Crime and Corruption (2016): €179-990 billion a year. https://www.rand.org/pubs/research_reports/RR1483.html
- ↩ Author's assumption; basis and range stated in Section 11 (Exhibit 8).
- ↩ Author's assumption; basis and range stated in Section 11 (Exhibit 8).
- ↩ Author's assumption; basis and range stated in Section 11 (Exhibit 8).
- ↩ M. Draghi, The Future of European Competitiveness, September 2024. https://commission.europa.eu/topics/eu-competitiveness/draghi-report_en
- ↩ Eurostat, Government finance statistics: EU general government gross debt around 80% of GDP. https://ec.europa.eu/eurostat/statistics-explained/index.php?title=Government_finance_statistics
- ↩ M. Draghi, The Future of European Competitiveness, September 2024. https://commission.europa.eu/topics/eu-competitiveness/draghi-report_en
- ↩ Author's assumption; basis and range stated in Section 11 (Exhibit 8).
- ↩ World Bank national accounts data, as summarised by Econofact (2025). https://econofact.org/factbrief/fact-check-has-the-economic-gap-between-europe-and-the-united-states-increased-in-the-past-decade
- ↩ IMF World Economic Outlook data, as compiled by StatisticsTimes (2026): US-EU comparison at market exchange rates and purchasing power parity. https://statisticstimes.com/economy/united-states-vs-eu-economy.php
- ↩ GIS Reports (2026): US real GDP growth averaged roughly 2.5% a year over 2015-2024 against about 1.7% for Europe. https://www.gisreportsonline.com/r/us-europe-economic-gap/
- ↩ M. Draghi, The Future of European Competitiveness, September 2024. https://commission.europa.eu/topics/eu-competitiveness/draghi-report_en
- ↩ Goldman Sachs Research (2023): generative AI could raise global GDP by 7% and productivity growth by 1.5 percentage points a year over a decade. https://www.goldmansachs.com/insights/articles/generative-ai-could-raise-global-gdp-by-7-percent
- ↩ McKinsey Global Institute (2023), The economic potential of generative AI. https://www.mckinsey.com/capabilities/mckinsey-digital/our-insights/the-economic-potential-of-generative-ai-the-next-productivity-frontier
- ↩ McKinsey (2025), Seizing the agentic AI advantage; agentic commerce sizing. https://www.mckinsey.com/capabilities/quantumblack/our-insights/seizing-the-agentic-ai-advantage
- ↩ D. Acemoglu, The Simple Macroeconomics of AI, NBER Working Paper 32487 (2024). https://www.nber.org/system/files/working_papers/w32487/w32487.pdf
- ↩ Author's assumption; basis and range stated in Section 11 (Exhibit 8).
- ↩ World Economic Forum, Global Agenda Council on the Future of Software and Society, Technological Tipping Points (2015). http://www3.weforum.org/docs/WEF_GAC15_Technological_Tipping_Points_report_2015.pdf
- ↩ PwC, Time for trust: The trillion-dollar reason to rethink blockchain (2020). https://www.pwc.com.cy/en/press-room/press-releases-2020/blockchain-report-2020.html
- ↩ European Commission, Simplification agenda: at least a 25% reduction in administrative burden, equating to €37.5 billion in annual savings by 2029. https://commission.europa.eu/law/law-making-process/better-regulation/simplification-implementation-and-enforcement/simplification_en
- ↩ Beglaubigt.de, digital incorporation via API and conversational interface. https://beglaubigt.de/en-us
- ↩ SynapseLayer production data (fDesk). https://synapselayer.ai
- ↩ European Commission, Giovannini Group, Cross-Border Clearing and Settlement Arrangements in the European Union (2001) and Second Report on EU Clearing and Settlement Arrangements (2003).